COVID-19: A New Modeling Method to Better Assess Epidemic Risks
For millennia, humanity has been struck by epidemics… Each time, it has taken protective measures that reflected the knowledge—or even the beliefs—of the era regarding modes of transmission. Take, for example, the plagues that ravaged Europe a few centuries ago. At the time, it was firmly believed that this devastating disease was caused by the inhalation of miasmas and the resulting imbalance of bodily humors. This led to the widespread use of masks stuffed with medicinal herbs and fitted with a pointed beak: this is the classic image of bird-beak masks…
Simon Mendez, University of Montpellier and Alexandre Nicolas, Claude Bernard University of Lyon 1
At the beginning ofthe 20th century, there was a major shift toward recognizing the predominant role of close contacts in transmission. Recommendations changed, and the preventive measures promoted at the start of the COVID-19 pandemic stemmed from this shift: handwashing, possibly with hand sanitizer, using disposable tissues, sneezing into the elbow, etc. All of this is intended to mitigate the risk of infection transmitted directly by hands or through objects contaminated (known as fomites) by an infectious person.
Over the past three years of the pandemic, the academic understanding of how respiratory diseases spread has undergone significant changes. What do we currently know about the mechanisms involved? How can we assess risks based on different situations—such as a café patio, a line where people are maintaining a certain degree of social distancing, or a busy street? We sought to answer these questions by developing a simple and rapid modeling method.
Shedding Light on the Mechanism of Aerosol Transmission
At this time, there is reason to believe that aerosol transmission is the primary mechanism by which COVID-19 spreads.
On this airborne research track, the collection of experimental data had begun well before the pandemic: the images from Lydia Bourouiba’s group showing the projection of microdroplets emitted during a sneeze (below), as well as those from the teams led by Lidia Morawska and William D. Ristenpart, among others, on the size of droplets and aerosols emitted during various expiratory activities, date back several years.
These studies show that coughing and sneezing can project aerosols over distances potentially exceeding 2 m, and that simply speaking for one minute can generate as many droplets as a coughing fit.
Despite these findings, disagreements persist regarding basic data such as the size distribution of the droplets and aerosols produced—a factor that is nonetheless critical for determining their fall time and likelihood of remaining suspended in the air indoors. Furthermore, experimental difficulties and ethical concerns prevent the study of all possible emission, inhalation, and environmental conditions.
Computational Simulation: The Solution?
How, then, can we increase the number of possible tests? One answer is to use digital tools, taking advantage of computers' processing power.
All that remains is to choose which system to simulate: airborne transmission occurs through the transport of viruses within droplets and aerosols formed in the respiratory tract (lined with mucus) and the mouth (filled with saliva), the challenge is to simulate the spread of these virus-carrying microdroplets from the moment they are emitted until they are inhaled—or even until they penetrate and settle in the respiratory tract.
Such fluid dynamics simulations have become widespread since the onset of the pandemic and have highlighted the complexity of the process, the importance of accurately describing the turbulent structures of the flow, the variability of the exhaled airflow depending on phonation, the sensitivity of droplet evaporation to the breath environment, and so on.
If we rely solely on crude models, the description of risks can be severely compromised, and in the early stages of the pandemic, we saw numerous studies emerge with questionable assumptions. Conversely, highly detailed models that sophisticatedly simulate the spread of respiratory droplets offer greater realism… But they face challenges due to the complexity of analyzing the data they produce (how should one handle these wide ranges of trajectories that vary with every minute change?) and their computational cost—the lifeblood of numerical simulations.
The "dynamic risk maps" solution
To get the best of both worlds, one approach is to use highly detailed fluid dynamics simulations—with a resolution on the order of a millimeter—and to estimate the risk dynamics around an emitter at a more aggregated level, that is, without concerning oneself with the precise location of each individual microdroplet.
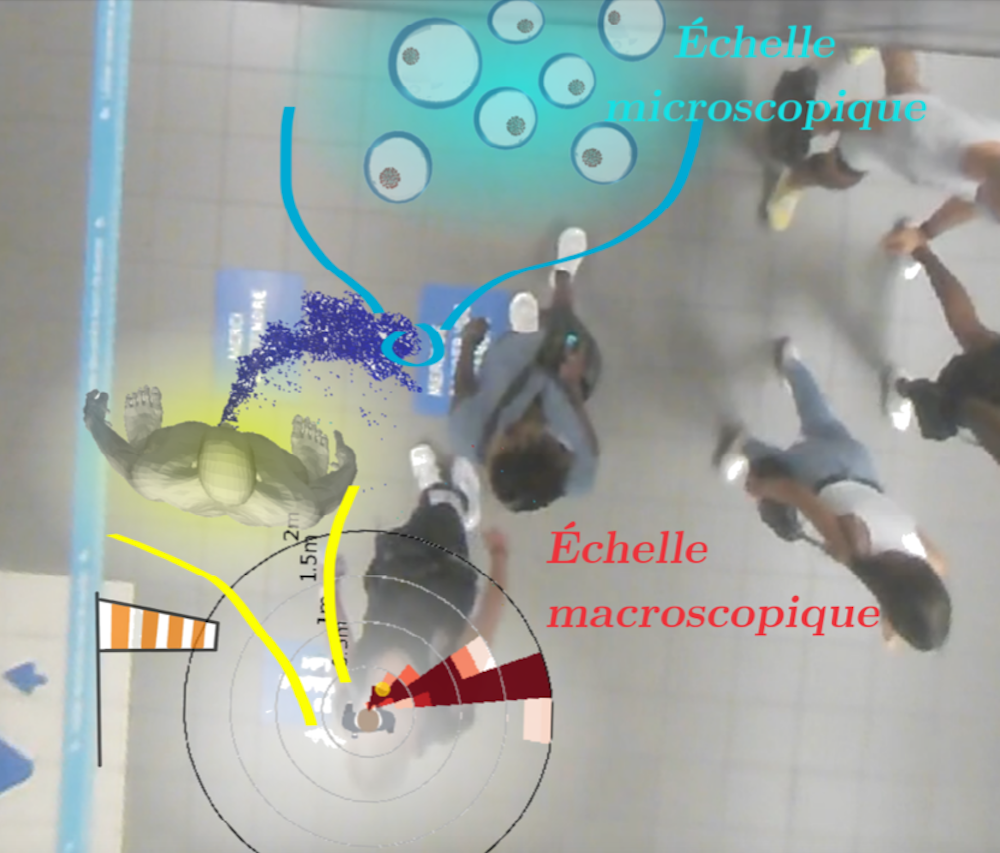
Except that a single map isn't enough: in reality, the resulting “risk map” varies depending on whether the person is talking or walking, as well as on the wind or drafts, and so on. We therefore need to build an entire library of reference scenarios and, in the gaps between them, infer the missing ones. That is what we have set out to do.
The results provide clear and simple insights. It turns out that even the slightest breeze in the area drastically reduces the risk of viral transmission. This puts an end to a debate that began at the start of the pandemic, when people wondered whether wind might actually increase the risk of infection by carrying droplets and aerosols farther. In fact, in all the scenarios studied, wind disperses them.
More generally, the significant reduction in computational costs made possible by the use of “dynamic risk maps” has made it possible to study real-world scenarios involving dozens or even hundreds of people.
Tangible Results
In practice, we were able to walk the streets of Lyon in the midst of the pandemic and set up our camera system (filming people from above while respecting their anonymity) in various locations, both outdoors and in indoor spaces with limited crowding (spacious and well-ventilated). These included an SNCF train station, a metro station, busy streets, an open-air market, café patios, and a developed riverside area along the Rhône.
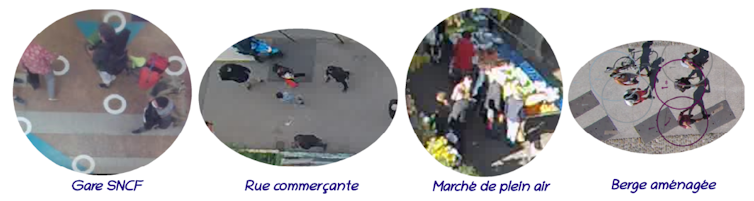
From these videos, we extracted the trajectories and orientations of the pedestrians' heads and combined this data with the aforementioned risk maps (Figure 1). Results:
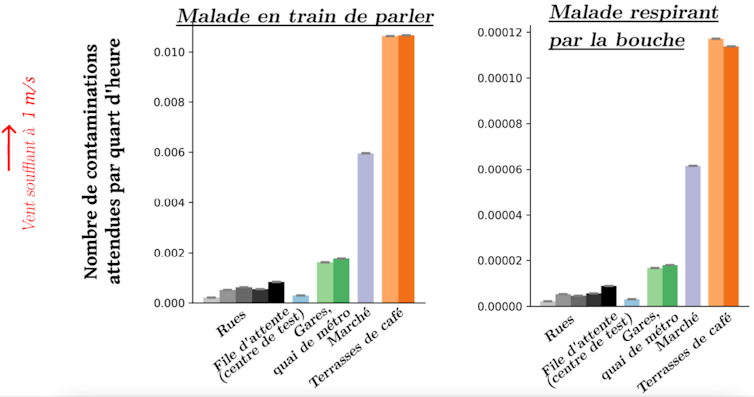
- Busy (but not crowded) streets pose a very low risk compared to the open-air market, where there were far more people and they were much closer together. As might be expected, density plays a major role.
- All of these situations posed a lower risk of new infections than café patios (Figure 3), where people have close and prolonged contact, even though the overall density there is lower.
- Exhalation plays a major role, since the amount of droplets emitted by a person who is speaking is much higher than when that person is breathing through the mouth (and, even more so, through the nose).
This prioritization of real-world scenarios based on theoretical and numerical models illustrates how high-fidelity simulations can be used to examine everyday situations. This can serve as a decision-making tool in public health policy.
The modeling tool thus serves as a valuable bridge between fundamental knowledge about airborne viral transmission and the public health measures that need to be implemented.
Strengths and Limitations of a Promising Approach
Compared to detailed approaches, in which the path of each respiratory droplet is predicted and influenced by numerous phenomena (air recirculation around street furniture, the influence of each pedestrian’s wake, etc.), our method makes it possible to estimate risks in real-world situations in just a few minutes, since the most computationally intensive simulations have already been carried out once and for all.
Admittedly, this comes at a cost: the impact of pedestrians other than the emitter is not taken into account, which proves to be a limitation in extremely dense crowds. Other effects, such as the influence of temperature on the dispersion of exhaled aerosols, could, however, be incorporated into future improvements.
Despite these limitations, the model has a wide range of applications, as it can be combined with field measurements for risk prioritization or coupled with simulated pedestrian trajectories. This makes it possible, for example, to quantify in advance the impact of architectural choices on transmission risks within a building or to manage crowd flow during an epidemic.
Simon Mendez, Research Fellow at the CNRS, Mathematics and Modeling Laboratory, University of Montpellier and Alexandre Nicolas, Research Fellow at the CNRS; physicist, Claude Bernard University of Lyon 1
This article is republished from The Conversation under a Creative Commons license. Readthe original article.