Globally, no decoupling is expected between GDP and energy consumption
To assess a country’s carbon footprint, not only are locally generated emissions taken into account, but also those embedded in imported products. Otherwise, relocating part of a country’s industrial activities abroad would create the illusion that it has reduced its carbon footprint. France’s carbon footprint, for example, is 11tCO₂/capita, whereas emissions from domestic production alone amount to only 5 tCO₂/capita.
Jacques Treiner, University of Paris and Jacques Percebois, University of Montpellier

A similar approach should be taken to calculate the energy footprint of GDP—that is, the amount of primary energy required to produce the goods and services consumed—while also accounting for the energy expended to manufacture imported goods and services. Here again, a reduction in a country’s energy intensity will be illusory if, at the same time, it relocates its industrial activities and then imports back the products it no longer manufactures.
While it seems logical that GDP growth would be accompanied by an increase in energy use, the correlation can become more complex over the long term when several factors are taken into account: energy savings resulting from improvements in energy-using equipment; the substitution of one form of energy for another (some are more efficient than others); and changes in the structure of GDP (the shift toward the service sector tends to reduce energy intensity, all else being equal).
Let's try to gain a clearer understanding by starting with the concrete reality we want to measure through these calculations.
GDP, Energy, and the Transformation of Matter
Every good or service is produced through various transformations of matter; a physical approach allows us to calculate energy balances, and monetary accounting contributes to GDP.
Energy consumption and GDP are therefore two ways of accounting for the same transformations of matter. The transition from one accounting system to the other is thus analogous to a simple change in units, which should result in a linear relationship between GDP and energy consumption—assuming here that nonmarket activities account for only a small portion of the production of goods and services. Do empirical data confirm this reasoning?
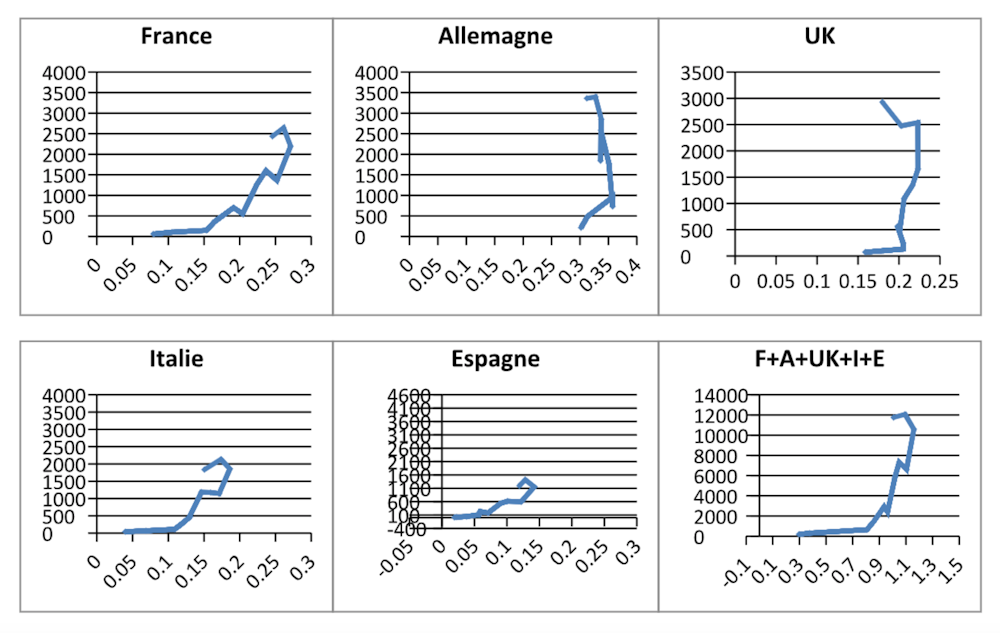
Let’s first take a look at the national figures, which seem to contradict this assertion. The cases of Germany and the United Kingdom show that, since the 1970s, energy-adjusted GDP has grown at a roughly constant rate, followed by an increase in GDP accompanied by a decrease in energy use.
Our World in Data
Striking contrasts between Europe and Asia
When we aggregate these five countries, which are representative of Europe, we can identify three phases, each characterized by a different slope in the GDP-to-energy ratio: the first, prior to the oil shocks of the 1970s; the second, marked by a sharp break in the trend, likely associated with a significant improvement in energy efficiency; and in recent years, a third phase marked by GDP growth coupled with a decline in primary energy consumption.
Part of this trend can be explained by a change in the structure of GDP, but also by improvements in energy efficiency. The key factor is, of course, the price of energy: oil shocks have made energy more expensive, which has led to greater efficiency and shifts between different forms of energy.
More recently, the introduction of a carbon price in industrialized countries may explain the efforts made to reduce per-unit consumption of products. However, this measure also has the effect of encouraging carbon “leakage,” which amounts to the relocation of polluting industries.
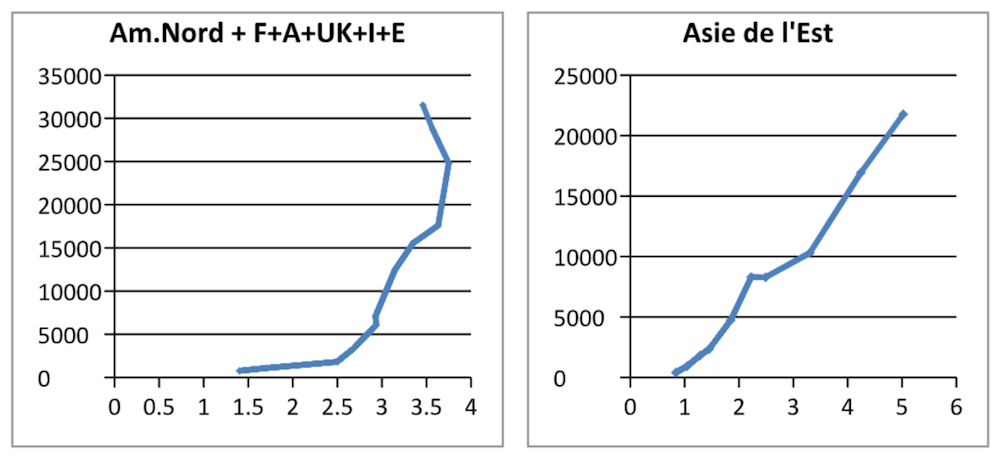
These three trends are confirmed when data for North America are included. A first shift in the trend occurred in 1975, as a result of the first oil crisis, followed by the onset in the early 2000s of a “strong decoupling” in wealthy countries: GDP growth with less energy consumption.
Our World in Data
The contrast is striking when compared to East Asia, where a trend can be observed that appears to confirm the initial hypothesis of a linear relationship between GDP and energy consumption.
As for the regions of the world not represented here—South Asia, Latin America, and Africa—they are following the same trend as East Asia, albeit with a lag of several decades.
However, these countries are characterized by a growing share of industrial activity—this is particularly true of China.
A decoupling that is more apparent than real
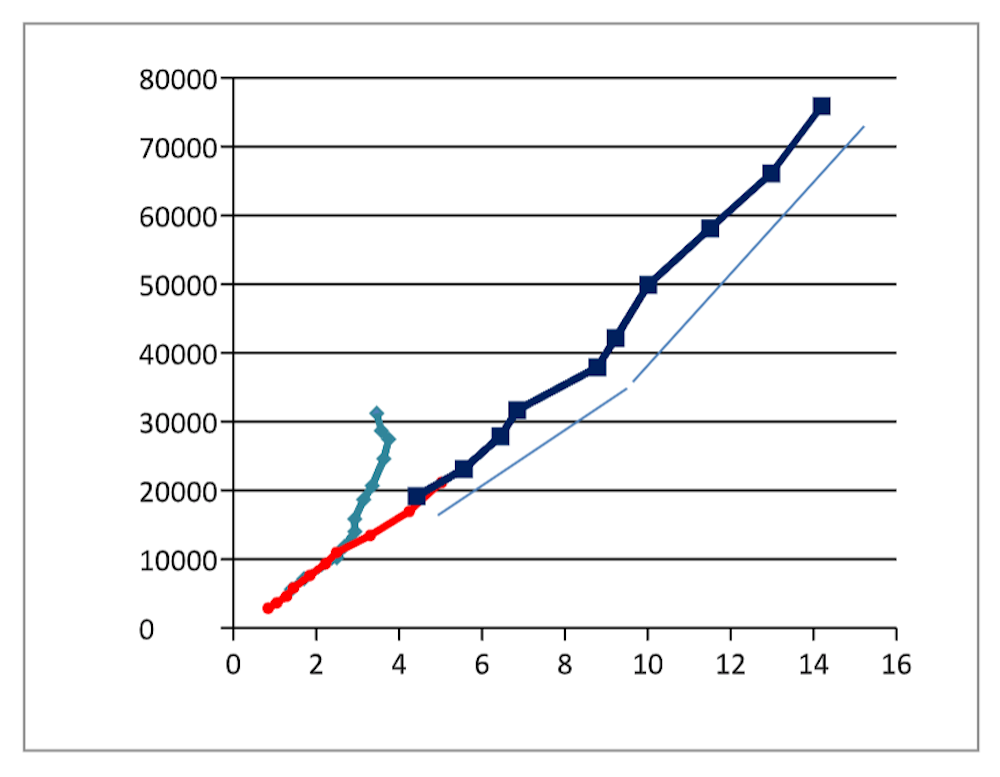
Let us now aggregate all the global data. We then identify two trends: a slight improvement in energy efficiency beginning in the late 1990s, but no “strong decoupling.”
Given that this trend is emerging just as China is entering the global market on a massive scale, the following interpretation can be proposed: to analyze the relationship between GDP and energy, one must either consider economically autonomous entities or take international trade into account. Only under these conditions can the same transformations of matter be accounted for, both in the calculation of their energy consumption and in their contributions to GDP.
Since the 2000s, many activities that are essential to the functioning of societies and highly energy-intensive have been relocated, particularly to China. The “decoupling” in wealthy countries is more apparent than real; it is primarily the result of their “partial deindustrialization.”
A linear relationship between GDP and energy consumption appears to be well supported by aggregated global data, with a slightly upward slope, reflecting a long-term improvement in energy efficiency.
World Bank
Globally, economic growth will therefore continue to be accompanied by an increase in energy consumption, at varying rates depending on the period.
At the regional level—and even more so at the national level—the situation will be different. Economic growth will lead to lower energy consumption, thanks to technological improvements and structural changes in GDP.
However, the energy saved in some countries will be used in others on behalf of the former. The sharp drop in final energy consumption expected in France by 2030, according to the PPE—which is projected to be accompanied by a significant reduction inCO2 emissions—may thus mask offshored consumption and emissions.
To gain a more precise understanding of the energy impact associated with a country’s GDP, it therefore seems essential to also take into account the energy content of its imports, in the context of globalized national economies.![]()
Jacques Treiner, theoretical physicist, research associate at the LIED-PIERI laboratory, University of Paris and Jacques Percebois, Professor Emeritus at the University of Montpellier, researcher at the CNRS Art-Dev UMR, University of Montpellier
This article is republished from The Conversation under a Creative Commons license. Readthe original article.