Planning for Better Care: The Case of Myocardial Infarction
According to the World Health Organization, 17 million people die each year from heart attacks and strokes.
Jérôme Azé, University of Montpellier; Jessica Pinaire, University of Montpellier; Paul Landais, University of Montpellier and Sandra Bringay, University of Montpellier

The organization notes that deaths from cardiovascular diseases account for approximately 31% of all deaths worldwide, making them the leading cause of death. The burden of these diseases is projected to rise to 11.06% by 2030, bringing the number of cases to approximately 36.2 million. Cardiovascular diseases are a major public health challenge that places a heavy burden on the sector’s resources.
In this context, addressing modifiable risk factors (smoking, physical inactivity, overweight or obesity, high blood pressure, type 2 diabetes, high cholesterol or triglyceride levels, etc.) is obviously essential. But there is also another important area to explore: improving health planning—the set of measures that enhance the efficiency of the healthcare system.
Demonstration using data on the flow of hospitalized patients with myocardial infarction in France.
See also:
Cardiovascular risk factors: a revolutionary discovery that isn’t all that old
Inequalities with serious consequences
Health planning aims to ensure the efficiency of the health care system, as well as to reduce inequalities and geographic disparities in access to care.
These inequalities begin with regional disparities in healthcare provision, with the most significant ones concerning the distribution of medical specialists. The Île-de-France and PACA regions, for example, have high densities of medical specialists, whereas these are much lower in northern or central France. Healthcare services are particularly scarce and distributed very unevenly in rural areas. Furthermore, 20 to 30% of hospital physician positions are vacant, and 30% of general practitioners are over 60 years old and cannot find replacements.
These inequalities can havesignificant consequences for health: as a result, one-third of French people, living far from healthcare services, forgo medical care. The greater the distance they must travel to receive treatment, the more the frequency of visits may decline, as may the willingness to undergo certain tests. Difficulties are also observed when emergency hospitalization is required (childbirth, heart attack, stroke, trauma, etc.).
Tracking care pathways to improve planning
Inequalities also extend to mortality risk. For example, France is the European country where the differences in the risk of dying before age 65 between people in manual and non-manual occupations are the greatest.
An effective way to help improve this planning is to gain a better understanding of a patient’s care history: what care they have received, how many times, and so on. Considered indicators of patients’ actual needs, these “care pathways” also provide information on the duration and costs of care. We sought to better understand these trajectories in the context of hospitalization for heart conditions.
What sets our approach apart is that we analyzed the national medical-economic databases generated by the Program for the Medicalization of the Information System (PMSI). The PMSI is managed by the Technical Agency for Hospitalization Information. This public institution, under the Ministry of Health, serves as a center of expertise in the four “fields” of hospital activity: medicine, surgery, obstetrics, and dentistry; follow-up care or rehabilitation; psychiatry; and home hospitalization.
In France, a discharge summary is generated for every hospital admission. This document describes a patient’s primary and associated diagnoses, certain characteristics of the stay (admission/discharge status, duration, etc.), as well as the procedures performed. These medical-administrative data are recorded in the PMSI databases. These are not intended for use in medical applications, but are valuable for healthcare planning.
Making information visible
In the era of healthcare digitization, many researchers are turning their attention to data mining methods. These methods have already proven effective in the healthcare sector, whether in identifying underdiagnosed patients, reducing healthcare costs, or detecting insurance fraud.
One challenge associated with using this data is successfully designing tools that can both process such a large volume of data and extract relevant information from it.
In the case at hand—myocardial infarction—we identified spatiotemporal patterns characterizing care pathways in order to better describe and understand patient flows. Specifically, using an artificial intelligence technique, we identified groups of individuals in the data who had experienced similar medical events over time.
The novelty of this method lies in grouping patients based on the similarity of the conditions listed in the PMSI database. For example, if one patient is admitted for an acute transmural myocardial infarction of the inferior wall, and another is admitted for an acute transmural myocardial infarction of the anterior wall, they will be considered to have experienced a “similar” medical event, as both diagnoses belong to the same subgroup of the disease “acute myocardial infarction.”
The patterns identified in this way were then incorporated into a visualization tool. This makes it possible to reconstruct the various possible courses of a disease. Here is an example of patient flows for women over 65 hospitalized for cardiovascular conditions.
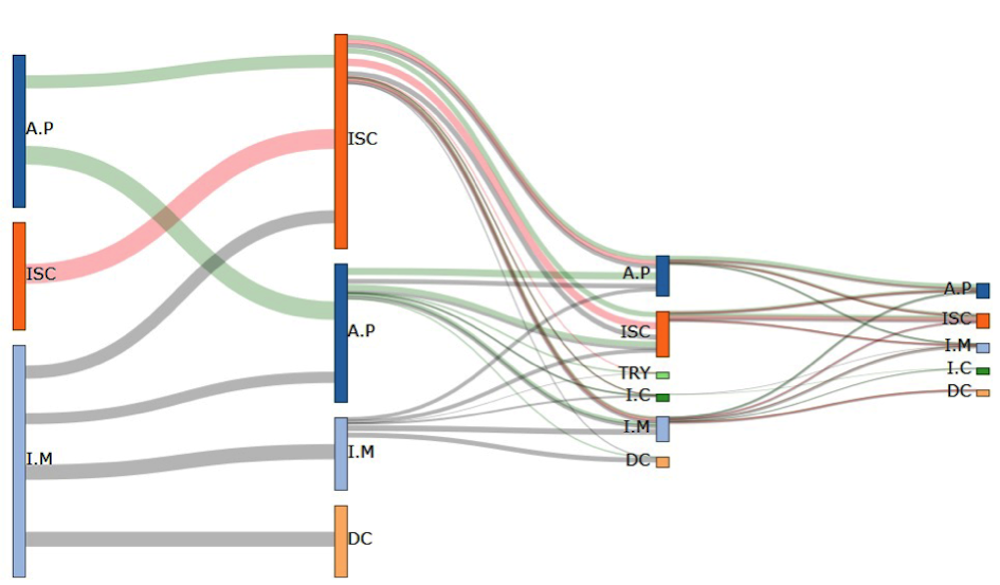
DR, Author provided
We were thus able to identify three pathways, whose initial events are angina pectoris, ischemic heart disease, and myocardial infarction, respectively. These pathways then branch into several sub-pathways, whose subsequent events include those already mentioned, as well as death. Starting with the third hospitalization, we observe the emergence of two new events: arrhythmias and heart failure. We also note that the patient flow decreases over time (as some patients have died compared to the initial flow).
This type of visualization helps identify three key stages in patient flow charts: myocardial infarction, angina pectoris, and ischemic heart disease.
The majority of patients show signs of recurrent coronary artery disease in the form of angina. Many of them also suffer another heart attack and/or develop ischemic heart disease. Others are affected by conditions such as an aneurysm, ischemia, arrhythmia, conduction disorders, or heart failure. Furthermore, data indicate that 21% of hospitalized men and 32% of hospitalized women die, most often during their first hospitalization.
These findings are consistent with some of the possible courses of myocardial infarction.
A powerful forecasting tool
In addition, we grouped these care pathways to identify trends in the time between hospital stays and changes in rates. Combining these patterns of time intervals and rates makes it possible to consider ways to support the implementation of new strategies for organizing care.
At the hospital level, these trends are invaluable for planning bed capacity and staffing. At the national level, this method enables a regional analysis. Indeed, previous studies have highlighted a north-south gradient not only for hospitalizations and readmissions, but also for mortality related to myocardial infarction. Analyzing patient flows by incorporating the patient’s region of origin would allow for comparisons of care and disease progression while accounting for this context.
Finally, the results obtained from these flow analyses can now be integrated into a decision-support tool for clinicians. This will enable clinicians to tailor their recommendations and warn patients about potential risks by comparing their profiles to those of patients with similar care trajectories.![]()
Jérôme Azé, University Professor, University of Montpellier; Jessica Pinaire, Research Engineer, University of Montpellier; Paul Landais, , University of Montpellier and Sandra Bringay, University Professor, University of Montpellier
This article is republished from The Conversation under a Creative Commons license. Readthe original article.